Haboob

An incredibly open and spacious desert with little to no opportunity to secure your resources. Forests are sparse, exposed and challenging to defend.
I. Starting resources
Food by source
 Herdables80028 %
 Main hunt680-80026 %
 Secondary hunt56020 %
 Berries75026 %
Gold and stone
Gold
 744
Stone
 54
Scenery variants (biomes)
Herdables


 8100 %
Main hunt


 2100 %
Secondary hunt

 4100 %
Predators


 2-3100 %
Relics by game size
How long the food lasts
The 2,850 starting food, gathered without upgrades by that many villagers at once.
AoE Buddy calculationWood

Wood in reach: the trees within 20 tiles of the Town Center, at 100 wood per tree. The gauge weighs this density and the distance to the first forest against Arabia (5 out of 10): a forest twice as far halves the score.
Analysed replaysPredators
Wolves and other aggressive animals on the whole map at the start.
Analysed replaysII. The terrain
Distance between players
Median distance between the two Town Centers in 1v1: the shorter it is, the earlier attacks arrive.
Analysed replaysNeutral resources
Piles halfway between players or far from the bases, to fight over; 5 relics on the map.
Analysed replaysSimilar maps
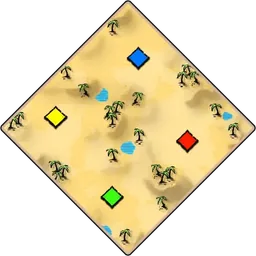 Arabian DesertOpen map88 %
 5=
 3▲
 5=
 5=
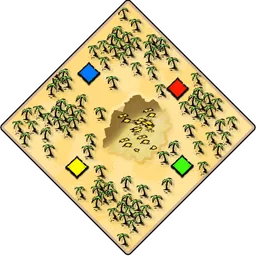 Golden PitOpen map78 %5=3▲2▼4▼
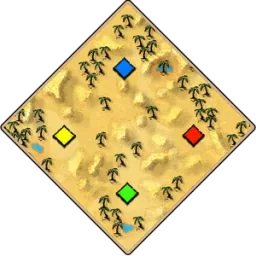 ArabiaOpen map76 %5=5▲5=5=
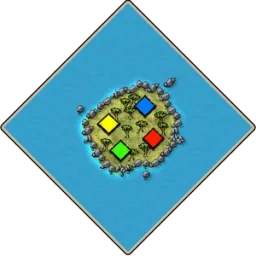 SocotraOpen map67 %4▼5▲3▼2▼
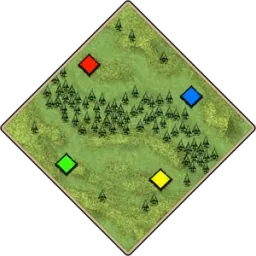 MichiClosed map58 %5=5▲5=5=
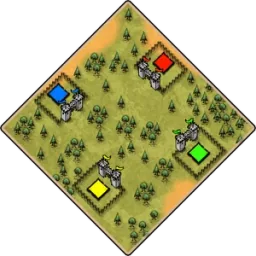 FortressClosed map57 %4▼5▲5=5=
Closest maps by amount of food, wood, gold and stone, and by map type. The numbers are each map's gauges out of 10 (Arabia = 5); ▲ and ▼ compare with this one.
Map sheetsBiomes and scenery
- Trees : Dragon trees, Palm trees
- Herdables
- Goat100 %
- Main hunt
- Rhinoceros56 %
- Elephant44 %
- Secondary hunt
- Ostrich92 %
- Zebra92 %
- Predators
- Lion100 %
A single scenery over the 27 analysed games: here is what spawns with it.
Analysed replaysIII. Games on this map
Game length
Share of ranked 1v1 games on the map by length, in game minutes (the in-game clock), current patch.
Ranked 1v1 gamesPopularity over time
Share of the map in ranked 1v1 games, month by month.
Ranked 1v1 gamesThe map by skill level
Share of the map in the games of each Elo range.
Ranked 1v1 gamesIV. Civilizations and strategies
Civilization popularity and win rate
Each civilization by its share of games (to the right) and its win rate (upward) on the map.
Ranked 1v1 gamesStronger here than elsewhere
 Bulgarians+6.4
 Goths+5.0
 Mayans+4.8
 Tupi+4.3
 Teutons-7.7
 Bohemians-9.1
 Turks-14.7
Gap between the win rate on this map and on all maps, in points (at least 200 games).
Ranked 1v1 gamesUnbalanced matchups
 vs
 32.8 %
 vs
 66.4 %vs
 64.7 %vs
 64.5 %vs
 64.3 %
 vs
 35.8 %
The most unbalanced matchups among the most played civilizations on the map (at least 100 games).
Ranked 1v1 gamesEvolution by patch
Win rate on the map of the four most played civilizations, over the last patches.
Ranked 1v1 gamesVariants measured on the ranked games analysed by AoE Buddy. Biomes (terrain, winter or desert scenery) will be detailed once they are read from the replays.