Hi, it's Nemzy, the dev behind AoE Buddy. One question was obsessing me: can we guess your Elo just by looking at how you play?
I analyzed 12,800 ranked 1v1 replays, from 600 to 2,800 Elo, and trained a model that looks only at you: not your opponent, not the result. Verdict: it lands within 100 Elo on 5 games.
Here's what the data says about how we play, and what didn't work.
1. The data in brief
- 12,800 ranked 1v1 replays, as many games at 700 as at 2,500, downloaded from the player's point of view to get their camera (10 positions per second). Plus 19,944 July replays for training.
- 335 indicators per player and per game: orders, camera, villagers, ages, fights, scouting, walls…
- 439 held-out players (15 games each): the model never sees them, and they're what we measure its error on.
All minutes in this article are game minutes (the in-game clock, which runs at ×1.7).
2. What separates the levels
Before building an AI, we asked the most direct question: which indicators go up (or down) with Elo? For each of the 334 indicators, we computed a rank correlation (known as “Spearman”) over 21,081 player-games.
How to read it: we rank players by the indicator, then by their Elo, and check whether the two rankings look alike. 0 means no link, +1 means the indicator ranks players exactly like Elo, −1 that it ranks them in reverse (that's the case for reaction times or pauses: the lower, the better). Above 0.5, it's a very strong link for a game as varied as AoE2.
Out of the 334 indicators, we kept 30 “key indicators” that a player can understand, just one per family (not three variants of camera jumps), across the game's seven domains. Here it is in console form:
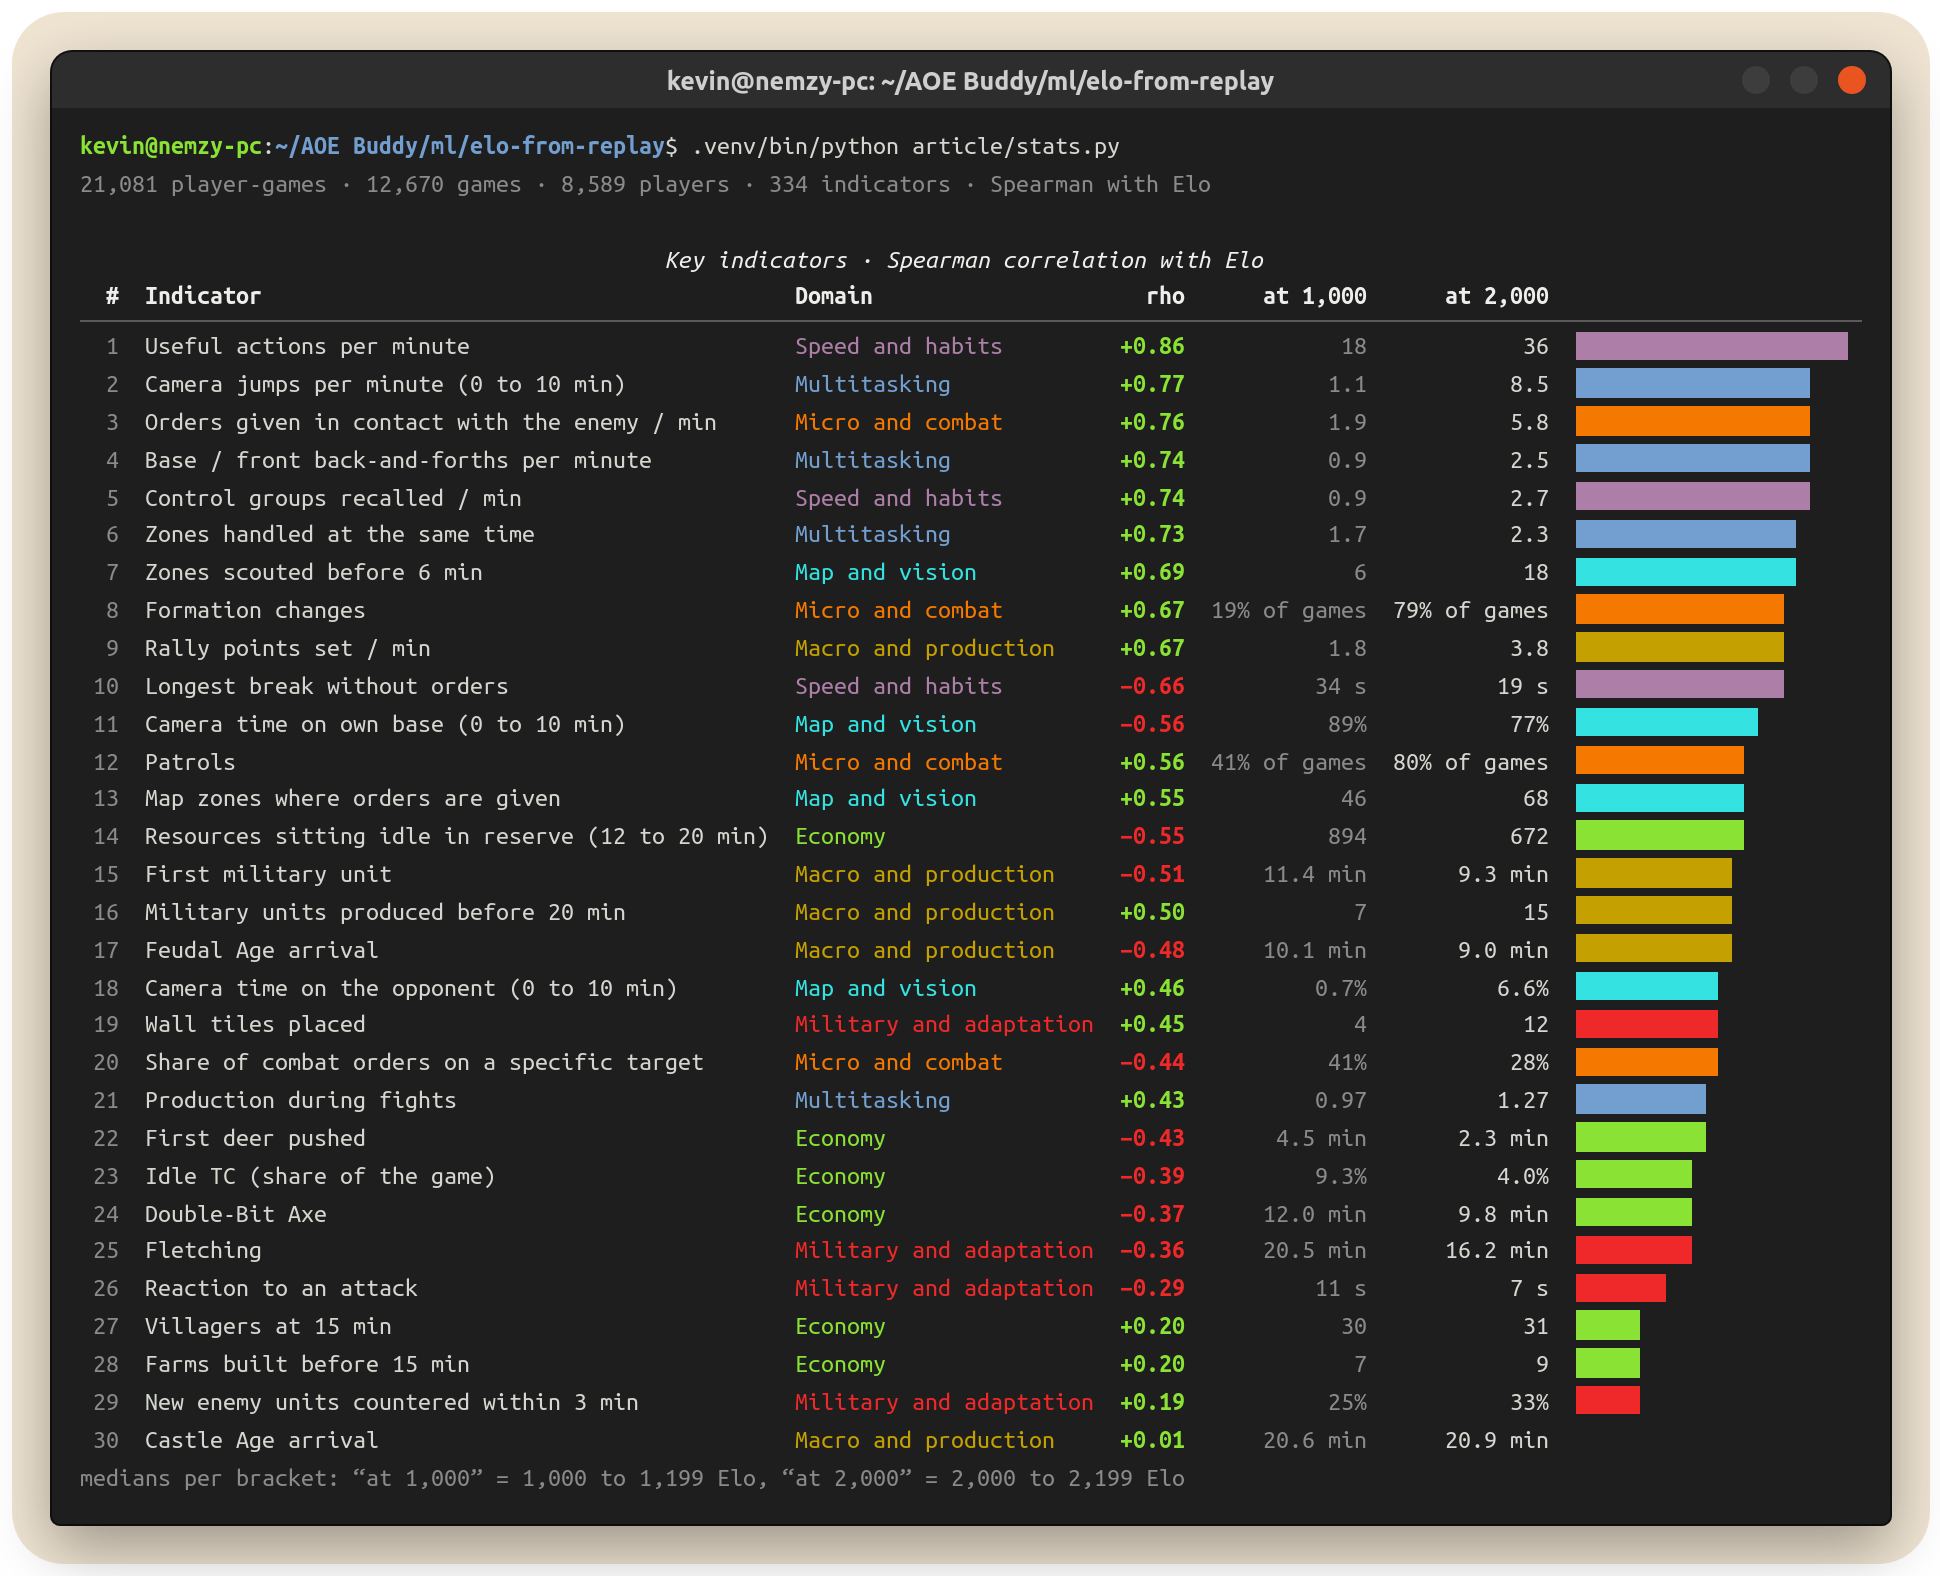
And the details, with what it means in practice. Throughout the table, “at 1,000” means players between 1,000 and 1,199 Elo and “at 2,000” those between 2,000 and 2,199 (medians, i.e. the middle player of each bracket).
| # | Indicator | Domain | rho | What it means |
|---|---|---|---|---|
| 1 | Useful actions per minute | Speed and habits | +0.86 | A 2,000 player gives 36 useful actions per minute, a 1,000 player gives 18: double. |
| 2 | Camera jumps per minute (0 to 10 min) | Multitasking | +0.77 | Before 10 minutes, 1.1 camera jumps per minute at 1,000, 8.5 at 2,000: about eight times more. |
| 3 | Orders given in contact with the enemy / min | Micro and combat | +0.76 | 1.9 combat orders per minute at 1,000, 5.8 at 2,000: you stop letting units fight on their own. |
| 4 | Base / front back-and-forths per minute | Multitasking | +0.74 | 2.5 back-and-forths per minute between your base and the outside at 2,000, 0.9 at 1,000. |
| 5 | Control groups recalled / min | Speed and habits | +0.74 | 2.7 group recalls per minute at 2,000 versus 0.9 at 1,000: control groups become a reflex. |
| 6 | Zones handled at the same time | Multitasking | +0.73 | In each 30-second window, a player at 2,000 acts in 2.3 distinct areas of the map, a player at 1,000 in 1.7. |
| 7 | Zones scouted before 6 min | Map and vision | +0.69 | 6 map zones targeted by the scout before 6 minutes at 1,000, 18 at 2,000: three times more map read. |
| 8 | Formation changes | Micro and combat | +0.67 | Used in 19% of games at 1,000 and 79% at 2,000. |
| 9 | Rally points set / min | Macro and production | +0.67 | 1.8 rally points per minute at 1,000, 3.8 at 2,000: double. |
| 10 | Longest break without orders | Speed and habits | −0.66 | The longest pause without any order goes from 34 s at 1,000 to 19 s at 2,000. |
| 11 | Camera time on own base (0 to 10 min) | Map and vision | −0.56 | Before 10 minutes, the camera stays on your own base 89% of the time at 1,000, 77% at 2,000. |
| 12 | Patrols | Micro and combat | +0.56 | Patrol shows up in 41% of games at 1,000 and 80% at 2,000. |
| 13 | Map zones where orders are given | Map and vision | +0.55 | 46 different map zones receive at least one order at 1,000, 68 at 2,000. |
| 14 | Resources sitting idle in reserve (12 to 20 min) | Economy | −0.55 | Between 12 and 20 minutes, 894 resources typically sit idle in the bank at 1,000, 672 at 2,000. |
| 15 | First military unit | Macro and production | −0.51 | The first military unit comes out at 11.4 min at 1,000, at 9.3 min at 2,000. |
| 16 | Military units produced before 20 min | Macro and production | +0.50 | 7 military units before 20 minutes at 1,000, 15 at 2,000. |
| 17 | Feudal Age arrival | Macro and production | −0.48 | Feudal Age arrival at 10.1 min at 1,000, 9.0 min at 2,000: one game minute apart, no more. |
| 18 | Camera time on the opponent (0 to 10 min) | Map and vision | +0.46 | Before 10 minutes, the camera spends 0.7% of the time on the opponent at 1,000, 6.6% at 2,000. |
| 19 | Wall tiles placed | Military and adaptation | +0.45 | 4 wall tiles over the game at 1,000, 12 at 2,000. |
| 20 | Share of combat orders on a specific target | Micro and combat | −0.44 | Clicking on a target accounts for 41% of combat orders at 1,000 and 28% at 2,000: good players move, pull back and regroup more. |
| 21 | Production during fights | Multitasking | +0.43 | Production during fights compared with the rest of the game: −3% at 1,000 (it slows down), +27% at 2,000 (it keeps going, even harder). |
| 22 | First deer pushed | Economy | −0.43 | When there are deer, the first one is hit at 4.5 min at 1,000 and at 2.3 min at 2,000. |
| 23 | Idle TC (share of the game) | Economy | −0.39 | The TC produces nothing 9.3% of the time at 1,000, 4.0% at 2,000: half as much wasted time. |
| 24 | Double-Bit Axe | Economy | −0.37 | Started at 12.0 min at 1,000, at 9.8 min at 2,000. |
| 25 | Fletching | Military and adaptation | −0.36 | Started at 20.5 min at 1,000, at 16.2 min at 2,000 (games where it's researched). |
| 26 | Reaction to an attack | Military and adaptation | −0.29 | Median reaction time to a raid: 11 s at 1,000, 7 s at 2,000. |
| 27 | Villagers at 15 min | Economy | +0.20 | 30 villagers at 15 minutes at 1,000, 31 at 2,000: almost nothing separates the levels. |
| 28 | Farms built before 15 min | Economy | +0.20 | 7 farms before 15 minutes at 1,000, 9 at 2,000. |
| 29 | New enemy units countered within 3 min | Military and adaptation | +0.19 | 25% of new enemy units get countered within 3 minutes at 1,000, 33% at 2,000: a modest gap. |
| 30 | Castle Age arrival | Macro and production | +0.01 | Castle Age arrival at 20.6 min at 1,000 and 20.9 min at 2,000: no difference (games where you get there). |
What this ranking tells us
1. Speed crushes everything. The useful actions per minute (without click spam) come out on top at +0.86: on their own, they rank players almost like Elo does. And it's not just about fast fingers: the longest pause without a single order (−0.66) says the same thing. A 1,000 player “zones out” for 34 seconds straight at least once per game; at 2,000, never more than 19.
2. Multitasking is the real signature of skill. Back-and-forths between base and front (+0.74), zones handled at the same time (+0.73), camera jumps (+0.77): good players aren't just faster, they are everywhere at once. A 2,000 gives orders in 2.3 different zones every 30 seconds; a 1,000 in 1.7, often their base and just one other spot. That's why we pulled multitasking out of “Map and vision” to make it a domain of its own, “Multitasking”: zones handled at the same time, base / front back-and-forths (+0.74), production during fights (+0.43). Until then, good scouting was hiding weak multitasking.
3. The map is read early. Before 6 minutes, a 2,000 player's scout has visited 18 zones, versus 6 at 1,000. And during the first 10 minutes, their camera spends nine times more time on the opponent.
4. Eco matters, but less than you'd think. Idle TC time is cut in half between 1,000 and 2,000 (9.3% vs 4.0%), but its correlation stays modest (−0.39): at the same level, the gaps between players are huge, some 1,000s run very smoothly and some 2,000s let their TC sleep. Resources sitting idle in the bank separate levels better (−0.55).
5. The big surprises.
- Villagers at 15 minutes: only +0.20. 30 villagers at 1,000, 31 at 2,000. The explanation is mechanical: a TC produces at best one villager every 25 seconds, and clicking up to Feudal blocks it for over two minutes. At 15 minutes, almost everyone is therefore stuck at the same ceiling, around 31 to 33. This number is also reconstructed from the orders (the replay doesn't contain the game state), so read it as an estimate.
- Reaching Castle Age tells you nothing (+0.01). 20.6 minutes at 1,000, 20.9 at 2,000. The age timing everyone watches is one of the worst indicators of skill. One caveat: we only count games where the player gets there.
- Clicking on a target drops with skill level (−0.44). Counterintuitive at first glance: you'd expect good players to aim better. In reality, they make something else on top: retreats, regrouping, repositioning. Clicking on a target becomes the minority.
On all these charts, each dot is one player in one game (60 drawn at random per 200-Elo bracket), the line follows the median player of each bracket and the light band contains the middle half of players. Hover over them to read the values.
Correlation doesn't mean recipe. Spamming patrol won't earn you 500 Elo. These indicators are traces of skill level: they show what good players do, not necessarily why they win.
The camera story
At the very start of the project, on a small first batch of 591 players whose camera we had (almost all between 1,000 and 2,000), the camera jumps per minute early in the game came out at +0.40. That was the first strong signal, and the starting point for a whole family of multitasking indicators: zones handled at the same time, base/front back-and-forths, production during fights, zones scouted.
Today, on 11,735 player-games from 600 to 2,800 Elo, this same indicator climbs to +0.77, and its little siblings follow: base / front back-and-forths +0.74, zones handled at the same time +0.73, zones scouted before 6 min +0.69, production during fights +0.43.
Honestly, a good part of this jump comes from the ladder range: a correlation mechanically goes up when you compare players from 600 to 2,800 rather than from 1,000 to 2,000. What the camera really brought is an idea: to measure not how much you click, but where.
Your turn to dig in
All 333 indicators are here. Pick one: the curve follows the median player of each 200-Elo bracket, from 600 to 2,800.
3. The AI that guesses your Elo
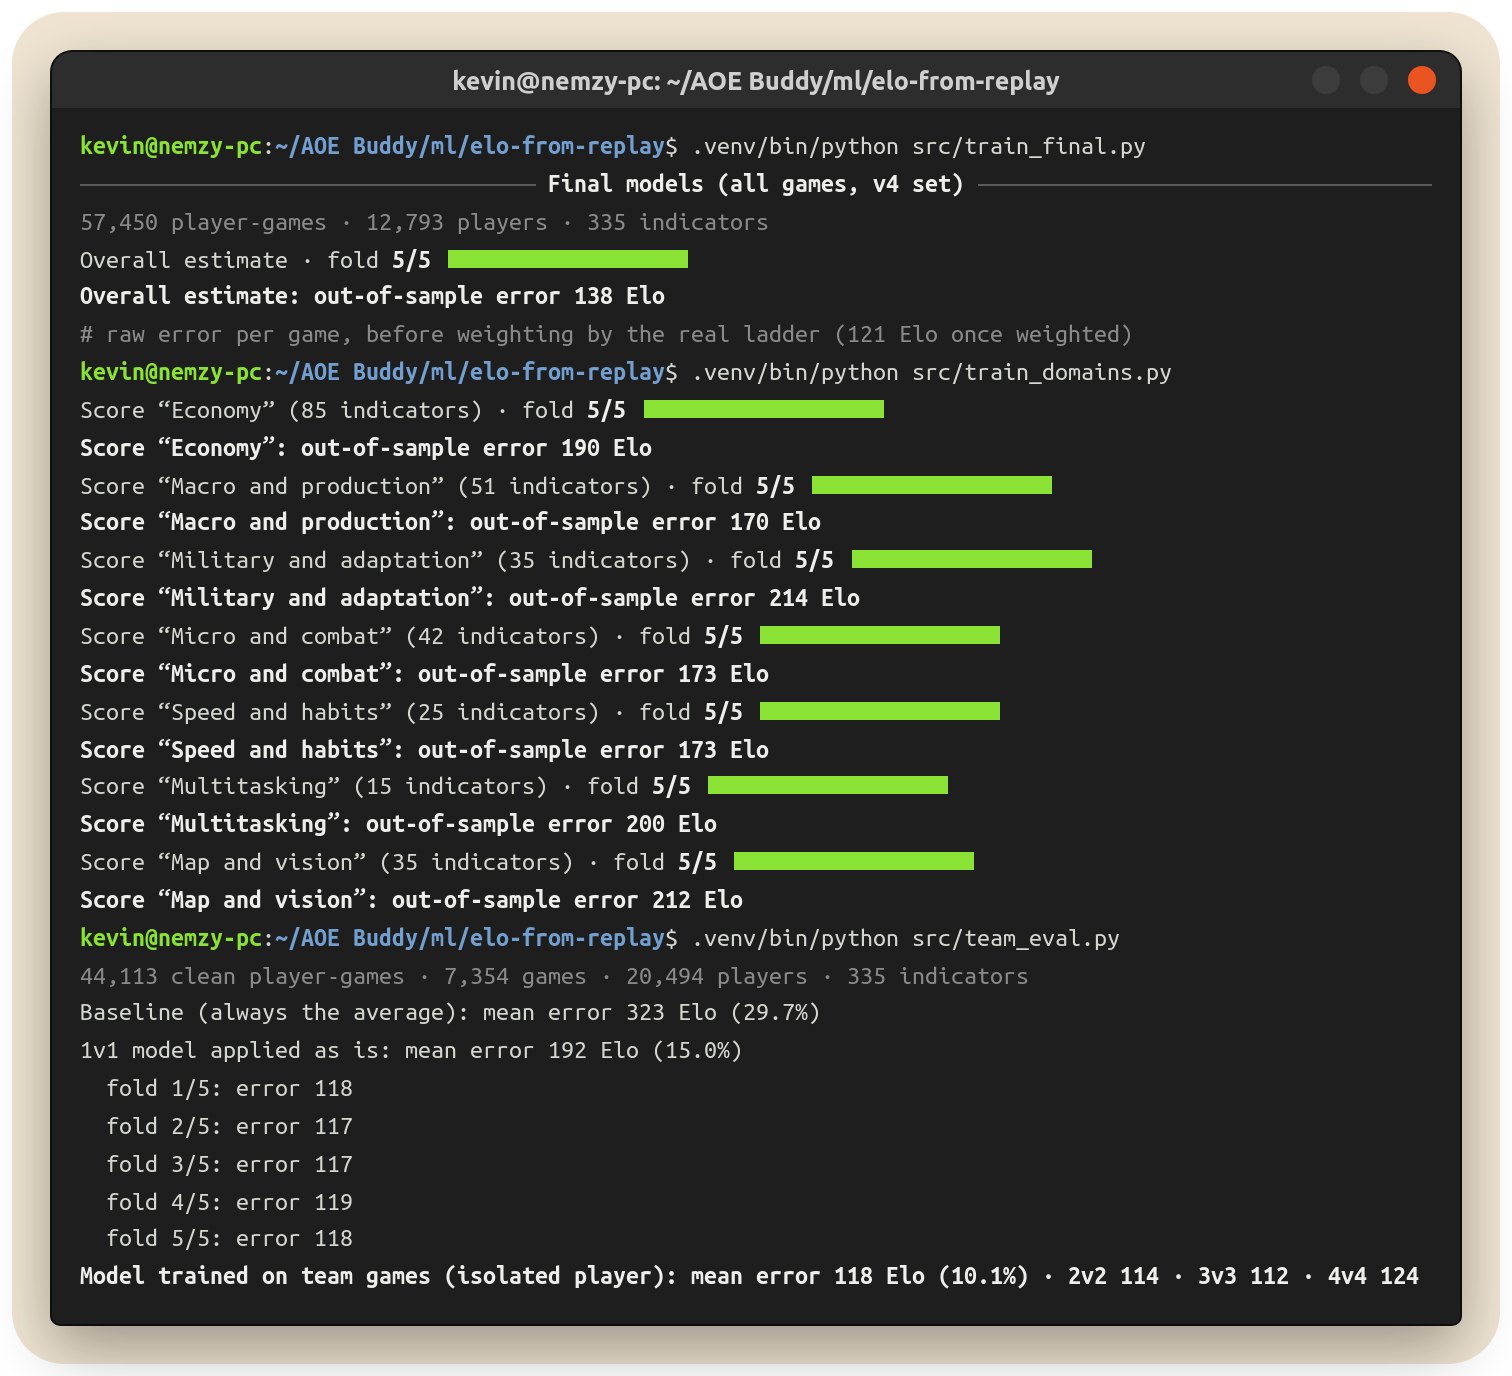
A correlation looks at one indicator at a time. To estimate an Elo, you have to combine them all. We used LightGBM, a decision-tree model widely used for this kind of number table: it learns rules like “if useful actions exceed 30 and the camera often leaves the base, then more like 1,800”.
Two important choices:
- Isolated player. The model sees nothing about the opponent: not their Elo, not their play, not the game's result. Only what you did. That's essential for spotting a smurf: they play against opponents at their fake level and win, and we absolutely don't want the model to base its estimate on that.
- Per-player validation. All games from the same player stay on the same side (training or test). Otherwise the model would recognize the player instead of estimating their level.
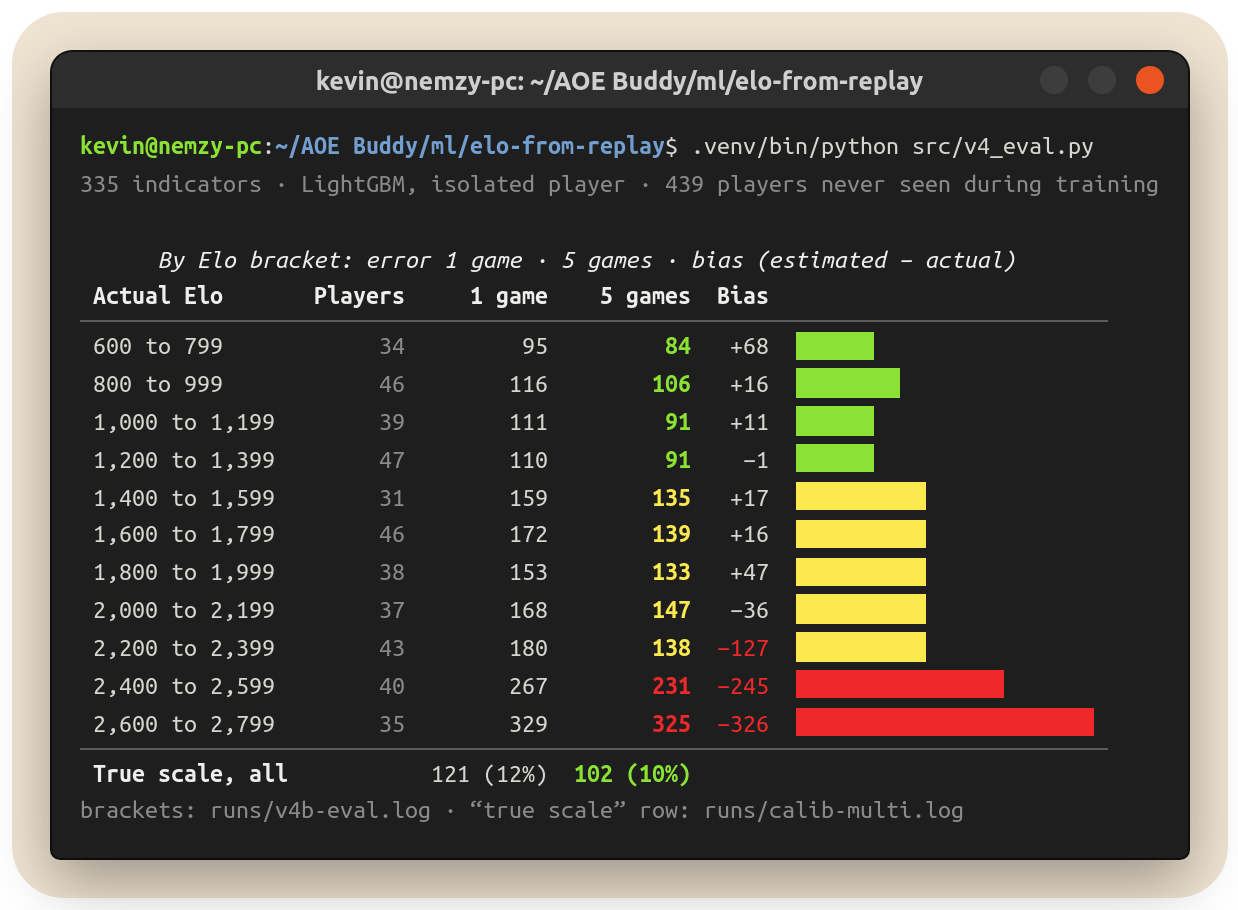
Weighting like the real ranked 1v1 ladder (where there are far more players at 1,200 than at 2,600), the average error is:
- 121 Elo on a single game (about 12%);
- 102 Elo over 5 games (about 10%).
These two averages come from the same model, measured on a half of the tracked players never used to tune the model. On the 439 tracked players, the same calculation gives 117 and 101: the difference comes from the sample, not the model.
The table by level says it all, including the uncomfortable parts. The bias is the estimate minus the actual Elo on one game: negative means the model underestimates.
| Actual Elo | Players | Error, 1 game | Error, 5 games | Bias |
|---|---|---|---|---|
| 600 to 799 | 34 | 95 | 84 | +68 |
| 800 to 999 | 46 | 116 | 106 | +16 |
| 1,000 to 1,199 | 39 | 111 | 91 | +11 |
| 1,200 to 1,399 | 47 | 110 | 91 | −1 |
| 1,400 to 1,599 | 31 | 159 | 135 | +17 |
| 1,600 to 1,799 | 46 | 172 | 139 | +16 |
| 1,800 to 1,999 | 38 | 153 | 133 | +47 |
| 2,000 to 2,199 | 37 | 168 | 147 | −36 |
| 2,200 to 2,399 | 43 | 180 | 138 | −127 |
| 2,400 to 2,599 | 40 | 267 | 231 | −245 |
| 2,600 to 2,799 | 35 | 329 | 325 | −326 |
| All levels (true scale) | 121 (12%) | 102 (10%) |
Two things jump out. At the bottom of the ladder, the model slightly overestimates the 600 to 799 players (+68): like any model of this kind, it pulls the extremes toward the middle of the ladder. And above 2,000, the trend clearly reverses.
The top is still a wall. From 2,200 up, the model underestimates (−127), then by 245 Elo between 2,400 and 2,599 and by 326 Elo above that. And looking at 5 games instead of one barely changes anything (329 vs 325 at the top of the ladder): this isn't noise, it's a ceiling. Our indicators simply no longer tell the elite apart. A 2,400 and a 2,700 both have 40 useful actions per minute, scout just as much and act in two or three areas at once. What separates them (reading the opponent's game, making decisions at the right moment, executing the decisive fights) doesn't show up in our numbers yet.
4. And in team games?
The same work was redone on 7,381 ranked team game replays (2v2, 3v3 and 4v4), i.e. 44,113 player-games. Still the same isolated-player principle: the model only looks at what the player does, not their allies, not their opponents, not the result.
- 118 Elo of error on a game (10.1%): 114 in 2v2, 112 in 3v3, 124 in 4v4.
- 100 Elo from 3 games on.
- The 1v1 model applied as-is to team games does much worse: 192 Elo, underestimating the players. Team games have their own benchmarks, so they needed a separate model.
- Leak check: by splitting the data per game (so that two teammates from the same game never end up one in training and the other in testing), the error stays at 116. So the model isn't cheating by recognizing the game.
- And the #1 indicator in team games is the same as in 1v1: useful actions per minute.
5. Everything that was useless
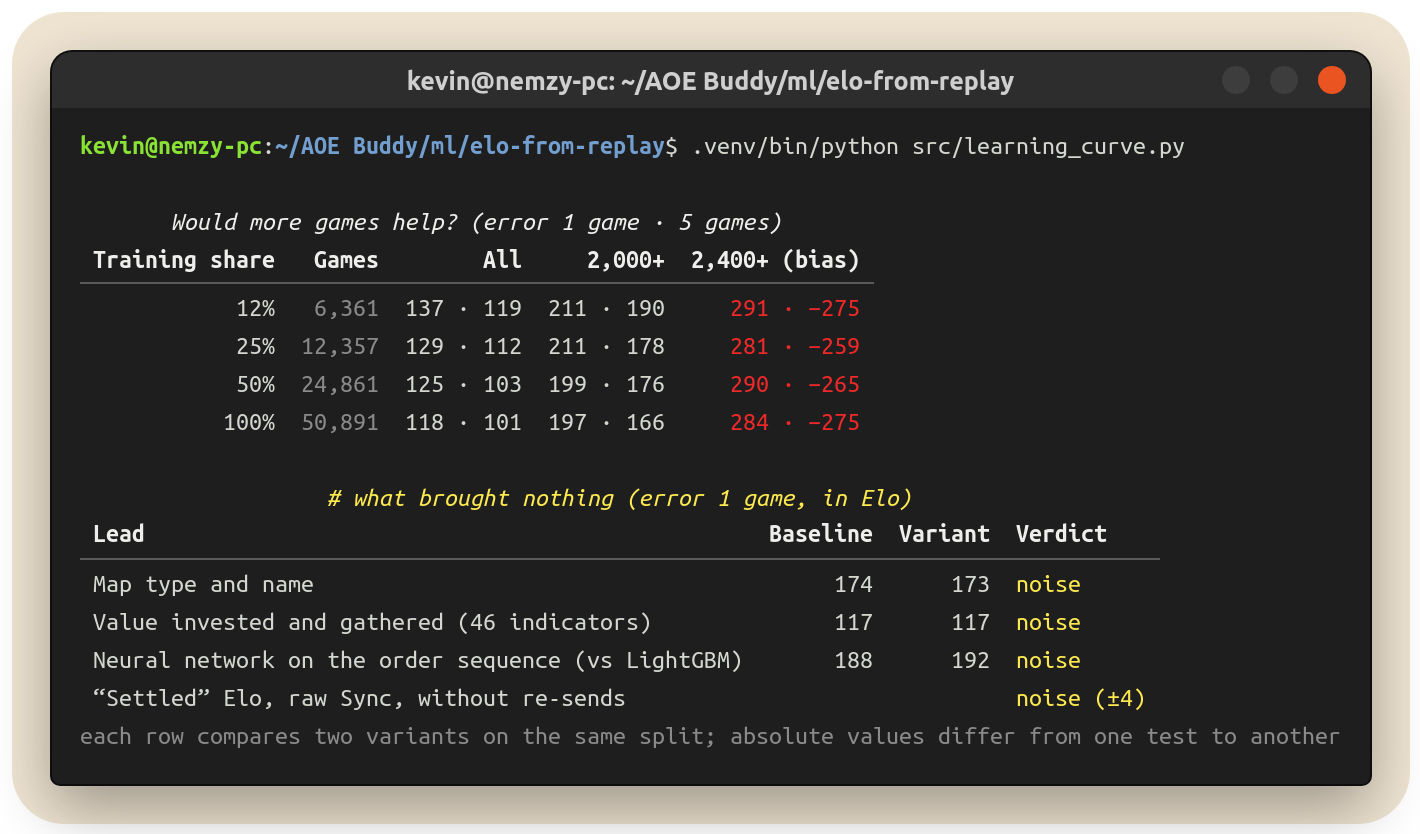
This is the part nobody ever talks about, and yet it took as much time as everything else. Each of these ideas seemed excellent. None of them moved the error by more than 4 Elo, which is noise:
- the map type (open, closed, water): 174 → 173;
- the “settled” Elo (correcting the Elo of recent accounts);
- the value invested and gathered, 46 more indicators: 117 → 117;
- the raw Sync packets of the replay;
- a neural network which reads the full sequence of orders: 192, versus 188 for LightGBM;
- removing the engine re-sends (orders the game sends back on its own).
What about adding games? The learning curve answers: every time we double the data, the error drops by 5 to 7 Elo. But above 2,400, it doesn't move at all anymore. More replays won't fix the problem at the top.
6. Who's going to win? The game minute by minute
As a bonus, we trained a second model on 12,793 games, which looks at the state of both players at every game minute (army, eco, technologies, age…) and derives a win probability. Enough to spot comebacks, thrown leads and the moment the game tips over.
A few numbers from this model (game state only, without Elo):
- a player who drops below a 25% chance for two minutes straight still ends up winning one time in six (17.6%);
- about 11% of games see a real comeback like this;
- in these games, the low point most often comes around the 29th minute (median), and they last much longer (49 minutes median, versus 38).
7. The “strategy” test: is there an invisible talent?
This is the question that sparked debate on the Discord. The hypothesis: some players have an Elo much higher than their measured play would predict. They'd have a talent our indicators can't see, let's call it “strategy”, that would make them win games their play didn't predict. The opposite hypothesis: this gap is mostly noise.
To settle it without cheating, the success criteria were written before running a single computation. Then we randomly split each player's games into two halves (200 times) to see whether what we measure on one half shows up on the other.
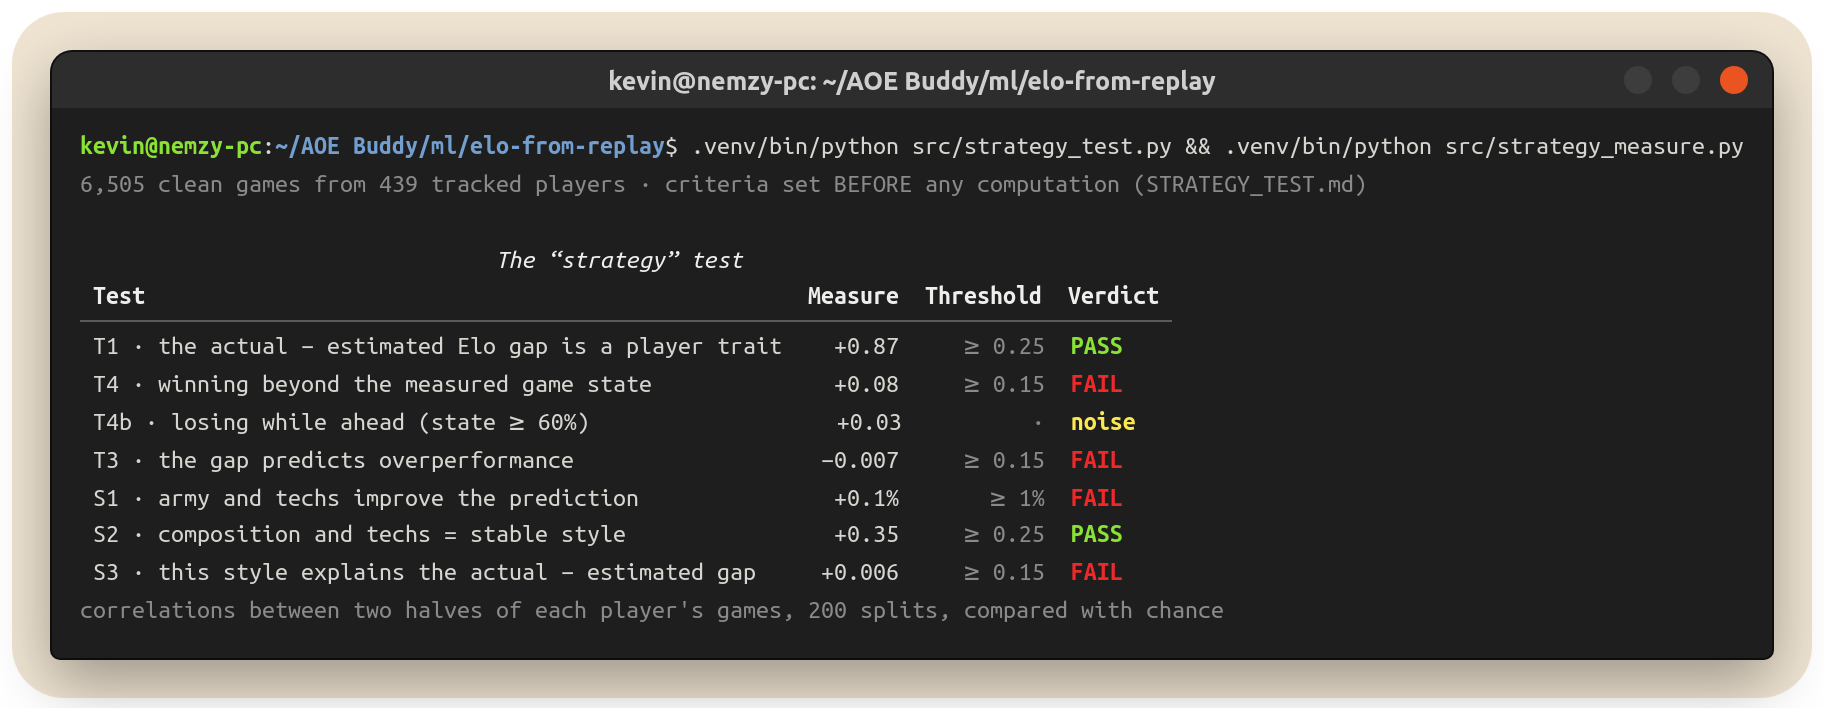
The results are clear:
- The “actual Elo minus estimated Elo” gap is a very stable player trait: 0.87 correlation between the two halves of their games. If the model underestimates you in your Monday games, it underestimates you in your Thursday ones too.
- But “winning beyond the measured state of the game” is not a trait (0.08), and neither is “losing while ahead” (0.03).
- And the gap doesn't predict overperformance (−0.007). Underestimated players don't win more “lost from the start” games than anyone else.
- Army composition and techs do form a stable style (0.35), but they improve neither the winner prediction (+0.1%) nor the Elo estimate.
And the most telling counter-test: the 20% most overestimated players, those whose measured play is above their Elo, win 59% of their games and are ahead at the three-fifths mark of the game (0.55 win probability based on the measured state). They're not “overrated”: they're on the way up, and their Elo hasn't caught up with their play yet.
Verdict: the gap between your play and your Elo is very real and truly yours, but it isn't some mysterious power to turn games around. It's more likely a mix of what we don't measure yet (the quality of decisive fights, for example) and an Elo that lags behind or runs ahead of the actual level.
8. Your play fingerprint
One last experiment, almost unsettling: we show the model 6 games, one of which doesn't belong to the player. It spots the odd one out 99% of the time (chance would give 17%). What gives a player away the most is their interface habits: their hotkeys, the way they select, the way they recall their groups. Without them, the model still recognizes the odd one out 78% of the time.
Your play style is a signature. For spotting a smurf or a shared account, that's very good news.
9. The takeaways
- Your replay tells your level within about 100 Elo over 5 games, without knowing anything about your opponent or the result. In team games too: 100 Elo from 3 games on.
- What makes skill is useful speed and multitasking, far more than age timings or the number of villagers at 15 minutes.
- The elite remains a mystery for the numbers: above 2,400, what makes the difference can't be read in the commands yet.
- “Invisible talent” didn't pass the test: the gap between your play and your Elo is stable, but it doesn't make you win lost games.
What now? The next step: understanding what happens at the top, where our 335 indicators are no longer enough.
Method, for the curious
- Correlations: Spearman between each indicator and the player's pre-game Elo, one row per player per ranked 1v1 game, games under 8 minutes excluded, on the full set (21,081 player-games, 12,670 games, 8,589 players). Checks: same calculation with a single row per player, and on samples where each 200-Elo bracket weighs the same; the ranking barely changes (the biggest difference concerns formation changes: +0.67, and +0.48 with a single row per player). Camera indicators only cover the player who recorded the replay (11,735 player-games).
- Medians: by 200-Elo bracket, from 600 to 2,800.
- Model: LightGBM, isolated player, player-level validation (GroupKFold), test on 439 never-seen players. Errors by bracket:
runs/v4b-eval.log; average weighted like the real ladder:runs/calib-multi.log(same model, v4 game, half of the tracked players not used for tuning). - Scripts:
article/stats.py(correlations),article/export_page_data.py(chart data).